- Original article
- Open access
- Published:
Schema-related cognitive load influences performance, speech, and physiology in a dual-task setting: A continuous multi-measure approach
Cognitive Research: Principles and Implications volume 3, Article number: 46 (2018)
Abstract
Schema acquisition processes comprise an essential source of cognitive demands in learning situations. To shed light on related mechanisms and influencing factors, this study applied a continuous multi-measure approach for cognitive load assessment. In a dual-task setting, a sample of 123 student participants learned visually presented symbol combinations with one of two levels of complexity while memorizing auditorily presented number sequences. Learners’ cognitive load during the learning task was addressed by secondary task performance, prosodic speech parameters (pauses, articulation rate), and physiological markers (heart rate, skin conductance response). While results revealed increasing primary and secondary task performance over the trials, decreases in speech and physiological parameters indicated a reduction in the overall level of cognitive load with task progression. In addition, the robustness of the acquired schemata was confirmed by a transfer task that required participants to apply the obtained symbol combinations. Taken together, the observed pattern of evidence supports the idea of a logarithmically decreasing progression of cognitive load with increasing schema acquisition, and further hints on robust and stable transfer performance, even under enhanced transfer demands. Finally, theoretical and practical consequences consider evidence on desirable difficulties in learning as well as the potential of multimodal cognitive load detection in learning applications.
Significance
Interactive learning and training technologies enhance task opportunities in various application domains but may also increase demands on cognitive resources. Arising pitfalls can be avoided by providing systems with knowledge about users’ current mental states, which allows regulating system responses in an adaptive and personalized way. For instance, during learning activities, a system could align features such as the amount and speed of the presented content or the degree of instructional support to increase motivation, encourage sustained performance, and foster system acceptance. Related challenges firstly involve measurement issues, i.e., an accurate user state recognition that requires intelligent algorithms for correctly interpreting patterns contained in the acquired signals. Secondly, the system behavior needs to be continuously adjusted to meet users’ needs in the most sophisticated way possible. The current research provides relevant pre-requisites for both issues by monitoring variations in cognitive demands over the task with a novel combination of sensitive measures related to performance, speech, and physiological reactions. Applying the summarized evidence to real-world applications, dynamic recognition algorithms could be developed for computerized learning devices such as mobile systems that incorporate wearable multimodal sensors.
Background
Looking back in the history of cognitive psychology, there is a long research tradition on cognitive schemata as crucial outcomes of learning processes (Ghosh & Gilboa, 2014). Once knowledge has been acquired successfully, it is represented and organized in small bundles of information that are constructed during learning and applied automatically in later process stages. Research in this field has mainly covered structural aspects (Bartlett, 1932; Rumelhart, 1980) and mechanisms of schema acquisition and adjustment (Piaget, 1952), but less concern was devoted to related demands on learners’ cognitive resources and their changes during the learning process. The current study addresses this research gap by monitoring the interplay of load inducing factors in a controlled learning scenario with a combination of continuous cognitive load measures.
Theoretical perspectives in cognitive load research
As we consider cognitive resource investment in instructional situations, the Cognitive Load Theory (CLT; Sweller, Van Merriënboer, & Paas, 1998; Sweller, Ayres, & Kalyuga, 2011) becomes an indispensable source of explanation. In brief, the theory resides on three core assumptions: Firstly, based on well-established memory models (Anderson, 1983; Atkinson & Shiffrin, 1971; Baddeley, 1992), it postulates limited working memory resources in terms of duration and capacity of information storage. Secondly, long-term memory resources are assumed to lack such boundaries and hold benefits for elaborated learning processes. Thirdly, mental representation of knowledge should occur via schemata, described as organized knowledge structures with stable patterns of relationships between elements (Kalyuga, 2010). A further characteristic of the theoretical framework is the separation of the overall cognitive load construct into the facets of intrinsic, extraneous, and germane cognitive load (Sweller et al., 1998). Whereas intrinsic cognitive load (ICL) results from the number of interrelated elements of information, determining the complexity of the used learning material relative to learners’ previous knowledge, extraneous cognitive load (ECL) is associated with the surrounding instructional situation, i.e., ways of content presentation or situational constraints. Germane cognitive load (GCL) arises from relevant processes of schema acquisition and automation. Prior research shows that high levels of ECL hamper learning performance, but only if high amounts of ICL are present at the same time (Sweller et al., 1998). Whereas ECL should be minimized and ICL kept at a manageable level, the instructional focus is put on fostering GCL to achieve optimal learning outcomes.
Theory-related discussions in the more recent past addressed the assumed additive relationship between ICL, ECL, and GCL (De Jong, 2010; Park, 2010; Sonnenfeld & Keebler, 2016) as well as substantial redundancies in the facet of GCL. This facet was introduced in addition to the initial two-component framework mainly on theoretical accounts instead of empirical evidence (Sweller et al., 1998). These issues resulted in efforts on reformulating the postulated theoretical framework. One approach suggests a reduction of cognitive load facets back into a two-component model, which contrasts productive factors beneficial for learning (ICL) with unproductive factors that impair learning (ECL) and subsumes GCL under the facet of ICL (Kalyuga, 2011; Kalyuga & Singh, 2016; Sweller, 2010). Another approach postulates a process-driven reconceptualization of the three-component model that quantifies temporal changes in GCL over the task (De Jong, 2010; Sonnenfeld & Keebler, 2016; Wirzberger, Esmaeili Bijarsari, & Rey, 2017). Following this view, ICL, ECL, and GCL reside at different levels of inspection: a structural level in terms of ICL and ECL, which can be determined a priori (Beckmann, 2010; Wirzberger, Beege, Schneider, Nebel, & Rey, 2016), and a processual level in terms of GCL, which undergoes changes throughout the learning task and depends on the achieved level of schema acquisition.
Empirical evidence for the latter approach arises from Wirzberger et al. (2017), who applied a basal learning task that a priori varied the amount of interacting information elements (ICL) and induced interruptions at several points over the task (ECL). Statistical analyses compared linear, quadratic, and logarithmic progression models, and the results suggested a logarithmic progression of schema-related cognitive load (GCL) over time, influenced by structural features. The resulting inversion of the learning curve (Ebbinghaus, 1964) aligns well with established evidence on cognitive skill acquisition (Anderson, 1983; Kraiger, Ford, & Salas, 1993; Shiffrin & Schneider, 1977). It also provides further evidence that building and organizing schematic structures of knowledge in the initial process stages shed higher demands on cognitive resources, whereas automation and tuning procedures in later process stages require smaller resource supplies. Although the approach already yielded promising results, the study raised the need for a more continuous controlled inspection of the determined mechanisms.
Related questions on the durability and robustness of previously established schemata might be addressable by applying acquired knowledge structures on distinct but related problems. Kalyuga (2010) particularly recommends tasks involving grouping or categorizing to create such transfer demands. Evidence on expertise development shows that novice learners require less complex tasks in early training stages to engage in robust and stable schema acquisition (Van Merriënboer, Kester, & Paas, 2006); thus, novice learners dealing with a complex task right from the beginning should perform worse. In addition, extended transfer requirements would overly demand cognitive resources and further decline performance.
Approaches to cognitive load assessment
Studying the assumed interplay of cognitive load factors requires their valid assessment. Several efforts have been made, relating to performance, psychophysiology, behavior, and self-report (Sweller et al., 2011; Wickens, Hollands, Banbury, & Parasuraman, 2013; Zheng, 2018). From the variety of approaches, a selection will be discussed in the following, which is considered to be relevant for the applied task framework.
Since learners’ performance is explicitly addressed and recorded in learning scenarios, the inspection of performance-related parameters offers valuable insights. Such measures usually operate on observable performance indices in dual-task paradigms that use secondary tasks to induce and/or assess cognitive load (O’Donnell & Eggemeier, 1986). If the secondary task mainly serves to induce cognitive load, primary task performance is observed, whereas the inspection of secondary task performance is applied for purposes of assessing cognitive load (Brünken, Plass, & Leutner, 2004; Brünken, Steinbacher, Plass, & Leutner, 2002; Kraiger et al., 1993; Park & Brünken, 2018). A conjoint observation of both aspects provides a more comprehensive view; thus, often both parameters are inspected complementarily. In terms of task-related stimulus and response modalities, evidence on modality compatibility in dual-task performance shows that for spatial codes a combination of visual input and manual output is superior to auditory input and vocal output, whereas the results are reversed for verbal codes (Hazeltine, Ruthruff, & Remington, 2006). For this reason, when employing dual-task techniques, compatible input and output modalities for both tasks should be used so that resource interference only occurs due to content-related processing demands. Participants’ performance in primary and secondary tasks can further be evaluated in terms of efficiency (Hoffman & Schraw, 2010), with higher levels of efficiency corresponding to high performance and low effort. Efficiency measures usually are calculated from effort indicators like response time, which indicates how cognitively demanding a task was, and performance indicators like correct responses (Sweller et al., 2011).
Bodily functions are often affected involuntarily when people are put under cognitive demands and thus provide reliable online indicators of current levels of cognitive load. Among the variety of psychophysiological techniques, heart rate (HR) and skin conductance response (SCR) have already shown sensitivity to changes in cognitive resource demands in dual-task settings (Mehler, Reimer, & Coughlin, 2012). Both parameters indicate increasing levels of imposed cognitive load by increasing values.
Besides involuntarily occurring bodily responses, participants show voluntarily behavioral reactions as well. The effects of cognitive load on duration-based speech parameters can be classified into the field of prosody, for instance, disfluency, articulation rate, content quality, the number of syllables, and silent pauses as well as filled pauses (Berthold & Jameson, 1999; Müller, Großmann-Hutter, Jameson, Rummer, & Wittig, 2001). Evidence suggests that, with increasing levels of cognitive load, speaking rates (the number of syllables per time) and articulation rates (the number of syllables per time excluding pauses) decrease. More and longer pauses during speech flow, induced by planning processes, also reflect higher levels of cognitive load (Esposito, Stejskal, Smékal, & Bourbakis, 2007; Khawaja, Ruiz, & Chen, 2007, 2008; Müller et al., 2001). So far, the described speech parameters have been applied to determine cognitive load in task settings that demand cognitive resources on a shorter time span, for instance, a reading span task or a Stroop interference task under time pressure (Yap, 2012). A novel perspective arises by applying this approach to capture naturally occurring changes in cognitive resource demands due to schema acquisition processes.
Beneath the introduced objective measures, subjective means of assessment can be applied as well. Self-report rating scales comprise an easily applicable and widely used approach in cognitive load assessment that relies on learners’ ability to provide valid retrospective estimations of the experienced level of cognitive load. A rating scale that addresses the facets of ICL, ECL, and GCL independently was developed by Leppink, Paas, Van der Vleuten, Van Gog, and Van Merriënboer (2013). Higher levels of subjectively experienced cognitive resource demands on each facet are indicated by higher ratings on the related items.
In summary, each measure entails certain strengths and weaknesses (Martin, 2018; Sweller et al., 2011; Wickens et al., 2013). Although performance-related parameters provide a continuous assessment and often emerge directly from the task, secondary tasks potentially interfere with primary tasks and require thoughts regarding the adequate level of complexity as well as the employed stimulus and response modalities. Psychophysiological techniques provide a continuous and reliable assessment, since physiological responses are hardly controllable voluntarily, but these techniques require special equipment, substantial expertise, and effort in application and analysis to avoid and control for artifacts and noise. Behavioral parameters also ensure a continuous and reliable way of assessment but require high expertise and effort as well. While subjective ratings via questionnaires are rather easily applicable, they provide no continuous assessment and rely on participants’ retrospective estimations of prior resource demands. For handling the outlined limitations, a combination of different assessment approaches is therefore regarded as the most promising solution to strengthen the informative value of the emerging results (Chen, Zhou, & Yu, 2018; Korbach, Brünken, & Park, 2018).
Present experiment
To address the outlined research gaps, the current study focused on changes in cognitive load related to the process of schema acquisition, extended by the issue of robustness of the obtained schemata. A basal learning task and a related basal schema application task (Kalyuga, 2010) provided a concise, controllable, and internally valid framework. By combining a set of continuous performance-related, behavioral, and physiological measures, completed by subjective self-reports, the comprehensive capture of underlying cognitive processes was ensured.
Hypotheses
Based on the introduced theoretical background, a logarithmically decreasing level of cognitive load with increasing schema acquisition was expected, which should be observable in performance, speech, and physiological parameters (hypothesis 1a). Moreover, an increase in subjectively reported cognitive load with a higher level of task complexity was postulated (hypothesis 1b). Regarding retention and transfer performance, with a higher level of task complexity a decrease in retention performance (hypothesis 2a) and transfer performance (hypothesis 2b) was assumed, as well as a decrease in transfer performance with increasing transfer demands (hypothesis 2c).
Methods
Pre-study
A schema application task was designed to address the robustness of participants’ schema acquisition. It required participants to categorize symbol combinations with reference to a displayed target symbol as either correct or false, according to previously acquired knowledge. Combinations were composed from the four geometrical symbols square, star, triangle, and circle. Some symbol combinations included non-prototypical symbols to determine if the established schemata were stable enough to deal with such kind of transformation. A pre-study should ensure that non-prototypical symbols are still categorized according to their underlying prototype.
Pre-study methods
Seventy-four participants (Mage = 35.00 years, SDage = 13.09, range 19–64, 63.51% female) completed the test. Of these, 54.05% had already graduated or were currently enrolled as graduate students, 20.27% had completed an apprenticeship, 10.81% were undergraduate students, and the remaining 14.87% reported diverse levels of graduation or did not reveal their educational status.
Non-prototypical symbols were generated with Adobe Photoshop and comprised different severities of either barrel (outward, negative deviation from 0) or pincushion (inward, positive deviation from 0) distortion. As displayed in Fig. 1, the levels of distortion ranged from small (± 30%) to medium (± 60%) to high (± 90%).
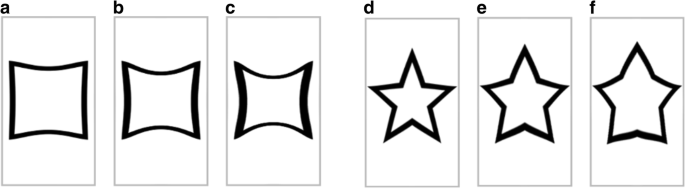
Distorted symbols. a = square 30, b = square 60, c = square 90, d = star − 30, e = star − 60, f = star − 90
Participants filled out an online questionnaire including the prototypical and non-prototypical symbols accompanied with a categorization request. After classifying each symbol as either circle, square, star, or triangle, participants had to rate the level of distortion on a seven-point Likert scale with verbal anchoring at the extreme points to determine the perceived severity of deviation from the underlying prototype. As the prototypes were included in the presented symbol set as well, the scale started from 0 (“not at all”) and reached 6 (“very strong”) to provide participants the opportunity of a valid and reliable rating on a sufficient level of complexity (Lozano, García-Cueto, & Muñiz, 2008).
Pre-study results
Descriptive analyses of categorization frequencies and distortion ratings are reported in Table 1. They indicate rather stable and homogeneous classifications of non-prototypical symbols according to their underlying prototype, with at least 94.7% correct categorizations, even on the broader distribution of age and educational backgrounds. Moreover, even on a descriptive level, distortion ratings outline an increasing amount of perceived deviation with increasing severity of distortion.
Repeated measures analyses of variance (ANOVAs) on the distortion ratings were computed separately for each symbol category, with severity of distortion as a sevenfold within-subjects factor. Mauchly’s test indicated a violation of sphericity for all symbol categories; therefore, the degrees of freedom were corrected using Greenhouse-Geisser estimates for circle, χ2(20) = 69.184, p < .001, ε = 0.751, square, χ2(20) = 61.139, p < .001, ε = 0.778, star, χ2(20) = 156.934, p < .001, ε = 0.608, and triangle, χ2(20) = 49.509, p < .001, ε = 0.837. The results indicated strong and highly significant main effects of distortion severity for circle, F(4.504, 388.761) = 109.263, p < .001, ηp2 = .599, square, F(4.668, 340.729) = 151.472, p < .001, ηp2 = .675, star, F(3.649, 266.373) = 87.503, p < .001, ηp2 = .545, and triangle, F(5.020, 366.476) = 175.157, p < .001, ηp2 = .706.
Post hoc pairwise comparisons with the Bonferroni-Holm correction (Maxwell, 1980) revealed significant differences between distorted symbols and prototypes for all levels of distortion severity in each symbol category (p < .001). When comparing outward and inward distortion within and across distortion severities, diverse patterns appeared depending on the symbol category. For both circle and square, no significant differences resulted between 30 vs. − 30, 60 vs. − 60, and 90 vs. − 90, whereas all other comparisons achieved significance with at least p < .05. In the star category, no significant differences resulted between 60 vs. – 60, 60 vs. 90, and − 60 vs. 90, but significant differences (p < .001) occurred for all other comparisons. All pairwise comparisons achieved significance in the triangle category with at least p < .05.
Based on both categorization frequencies and distortion ratings, non-prototypical symbols with superior psychometric properties were chosen. In addition to considering correct classifications and significant pairwise comparisons, a balanced representation of both barrel and pincushion distortion across symbols was sought. The resulting pattern comprised − 30, − 60, − 90 for circle, − 30, 60, − 90 for square, 30, 60, − 90 for star, and 30, − 60, − 90 for triangle.
Main study
Participants
A total of 123 undergraduate and graduate students (Mage = 22.67 years, SDage = 3.55, range 18–34, 76.42% female) participated in the main study. They were enrolled in Communication Science (41.32%), Psychology (30.58%), Science, Technology, Engineering, and Mathematics (STEM) fields (11.57%), Humanities (9.09%), or Education (5.79%) and received either a financial allowance of 5€ (49.59%) or course credits (50.41%) as compensation. Experimental conditions did not differ regarding age, t(119.05) = 0.62, p = .539, d = 0.111, gender, χ2(1) < 0.01, p = .960, distribution of study courses, χ2(6) = 4.42, p = .620, or compensation choice, χ2(1) = 0.40, p = .527.
Design
The chosen learning task required participants to detect, remember, and retrieve four easy or difficult combinations of arbitrary geometric symbols while simultaneously memorizing five-digit number sequences as a secondary task. The resulting experimental design included task complexity as an independent between-subjects factor that varied due to the arrangement of the symbol combinations (three vs. four symbols, symbol order). As dependent variables, learners’ performance in both primary and secondary task, spoken responses on the secondary task, and physiological reactions were recorded continuously during the learning task. The standardized cognitive load questionnaire by Leppink et al. (2013) provided a summative evaluation of the inspected cognitive load facets. An open question on schema recall after the learning task enabled insights into the quality of schema acquisition over the task. Participants’ working memory capacity was derived from a translated version of the automated operation span task (OSPAN; Unsworth, Heitz, Schrock, & Engle, 2005) and used as the control variable.
With reference to the CLT, task complexity reflected the ICL component and was addressed according to the concept of element interactivity (Sweller, 2010). Unlike the work of Wirzberger et al. (2017), the scope of symbol combinations was increased by one element to avoid effects of boredom due to insufficiently low levels of task demands. The embedded secondary task characterized the ECL component, which aligns with the conceptualization of ECL as situational constraints (Wickens et al., 2013). Furthermore, the combined inspection of the continuous cognitive load measures hinted at the underlying cognitive resource investment pattern and represented the GCL component (Sweller et al., 2011). Whereas primary task efficiency resources were invested in schema acquisition relative to the achieved outcome (Hoffman & Schraw, 2010; Paas & Van Gog, 2006), secondary task efficiency hinted at the actual load imposed by the primary task. Based on this view, available resources would arise only due to already established and usable schemata (Kraiger et al., 1993).
An additional task on applying the obtained schemata by solving a categorization task addressed the robustness of the schema acquisition process. It required participants to evaluate the correct match of displayed input and response parts of the previously acquired symbol combinations, which included distorted symbols in parts of the trials. The underlying 2 × 5 factorial mixed design included a between-subjects factor task complexity (easy vs. difficult) and a within-subjects factor level of distortion (0 vs. 30 vs. 60 vs. 90) as independent variables. Reaction time and a corrected error score were recorded as dependent variables.
Materials
Learning task
Computer-based tasks were realized with OpenSesame (Mathôt, Schreij, & Theeuwes, 2012) and provided on a standard desktop computer with a 24″ monitor. Trials within the learning task were inspired by the procedure of the OSPAN (Unsworth et al., 2005) and comparable automated complex span tasks, which include a distractor task and a target task in each trial in alternating sequence. In the current study, within each trial the number task (secondary task) was presented first as a distractor and followed by the symbol task (primary task) as a target. Unlike the complex span task procedure, which involved new items to memorize in each trial for both the target and distractor tasks, the learning content of the primary task persisted during the entire task.
As outlined in Fig. 2, each of the 64 trials started with the auditory presentation of a unique randomly chosen five-digit number for 5000 ms. The amount of five digits, as well as the used time spans, was determined within a short internal pre-test with N = 7 participants (Mage = 28.71, SDage = 2.43, range = 26–32, 4 male) and chosen to avoid distraction effects on the primary task by an overly complex secondary task. Indicated by a black speaker symbol on the screen, participants had to listen carefully and memorize the numbers in correct sequence. Afterward, a randomly chosen input part of one out of four abstract symbol combinations was presented for 2 s. This input part comprised two symbols (easy condition) or three symbols (difficult condition). Participants had to remember the shown symbols in correct order and complete the sequence by choosing a symbol as a response on the next screen by mouse click. In this vein, a total of three (easy condition) or four (difficult condition) symbols formed a complete combination. As shown in Fig. 2, the response screen simultaneously presented the four possible response symbols in a randomly arranged 2 × 2 grid for 5 s. This was followed by a feedback screen lasting 2 s that also included the correct choice for false responses to foster correct schema acquisition. Finally, indicated by a black speech bubble symbol, participants had to recall the memorized digit sequence from the trial outset verbally within 5 s.

Schematic outline of the trial procedure in the learning task. Superscript indices indicate affiliation with the primary1 or secondary2 task
Schema application task
During each of the 60 trials in the schema application task, participants evaluated if the input part of a presented symbol combination matched or mismatched the response part. As depicted in Fig. 3, the response part of the symbol combination was shown in the upper part and the potential input part in the lower part of the screen. Response parts were always represented in prototypical symbols, whereas half of the input parts included distorted symbols from the pre-study. The pool of presented stimuli comprised correctly matched input and target parts, existing input parts with mismatched target parts, and non-existing input parts with mismatched target parts. Within 5 s, participants had to classify the presented combination as false or correct by pressing either the left (false) or right (correct) mouse key. Contrary to the learning task, participants received no further feedback on their response.
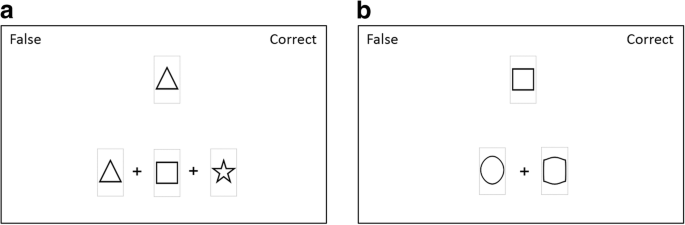
Stimuli in the schema application task: a difficult condition with prototypical symbols and b easy condition with distorted symbols
Questionnaires on retention and cognitive load
For assessing retention performance, participants received a computer-based form with a grid of three (easy condition) or four (difficult condition) empty boxes per combination in four rows. They had to recall the memorized symbol combinations by dragging symbols from an infinite pool for each possible symbol (i.e., circle, square, triangle, or star) via mouse click and dropping them into the existing grid boxes to form combinations. In addition, they could indicate corrections on the provided combinations in a separate comment space below. Participants’ subjectively perceived level of cognitive load was addressed on 11-point Likert scales via the 10-item questionnaire by Leppink et al. (2013) that differs between the three subscales of ICL, ECL, and GCL.
Procedure
Data were obtained in individual testing sessions of about 60 min in a separate laboratory, equipped with a standard desktop computer for the participant and an experimenter netbook to record the physiological data. At the outset of each testing session, participants were welcomed and signed an informed consent. This form outlined the purpose and procedure of the study and ensured that participants’ treatment aligned with approved ethical standards and that their privacy was respected. Afterward, the OSPAN had to be completed, which usually took about 15 min. Before starting the learning task, the experimenter had to fulfill several preparatory duties, requiring about 5 min. First, the electrodes for the physiological measures were attached to the left hand and a close-talk microphone for the speech recording was placed at the upper part of the participant’s sternum. Following an initial adjustment of the speech recording volume to individual voice characteristics, the learning task was completed within an average duration of 20 min. After the electrodes were removed, participants worked on the questionnaires on retention, cognitive load, and demographics, which were provided online and were completed in about 10 min by most participants. Finally, they completed the schema application task (about 10 min) and were debriefed and approved.
Scoring
Primary task efficiency was computed, following the likelihood model (Hoffman & Schraw, 2010), as the quotient of correct responses (performance) and reaction times (effort) within each trial. Since reaction times were retrieved in milliseconds, scores were multiplied by 1000 to obtain the proportion of correct responses per second. The resulting values provide a hint on the investment of available mental resources over the task: if learners start to perform faster and less erroneously on the task, they must invest less mental capacity.
For secondary task efficiency, also based on the likelihood model approach (Hoffman & Schraw, 2010), performance was computed by comparing spoken words to correct words from the reference and subtracting the amount of substituted, deleted, and inserted words (Lee, 1988) relative to the total number of words in the reference (word accuracy). The participant’s effort was reflected in the time starting from the presentation of the visual stimulus to the end of the last uttered digit (verbal response duration), which covered the entire answer process.
Speech parameters were extracted on the phoneme level using an automatic speech recognition system (Herms, 2016). The resulting transcripts included spoken units and the corresponding time codes in milliseconds and were used to derive the articulation rate, the number, and the mean duration of silent pauses. The articulation rate represented the total number of phonemes divided by the utterance duration excluding the total duration of silent pauses, the number of pauses reflected the total number of silent pauses in an utterance, and the mean pause duration was calculated from the total duration divided by the number of silent pauses.
Physiological data were recorded at a frequency of 128 Hz with a NeXus-10 Mark II from sensors attached to the volar surface of the distal phalanges of the left hand. While the heart rate (HR) signal was obtained at the trigger finger, the skin conductance response (SCR) was recorded at the middle and ring fingers. Data preparation involved the calculation of an individual baseline for each participant from values located in the preparation phase of about 5 min before starting the learning task. Recorded SCR and HR values were normalized to the individual baseline value and aggregated on mean values for events within each trial. Each event represented a subtask within the learning trial and was related to a screen change, i.e., the auditory presentation of a number sequence, the visual presentation of the symbol combination input, the response part of the presented symbol combination, a feedback on the given response, and finally the verbal recall of the memorized number sequence.
For obtaining retention performance, sum scores were calculated for all memorized symbol combinations and all correctly memorized symbol combinations, resulting in values ranging from 0 (neither combination memorized correctly) to 4 (all combinations memorized correctly). Transfer performance was obtained from the schema application task in terms of reaction times on the provided classifications as well as correct responses. The latter were adjusted for inherited errors from the retention task.
Cognitive load scores were derived from sum scores for each cognitive load facet, resulting in a maximum of 30 points for ICL and ECL and a maximum of 40 points for GCL. Subscales achieved satisfying internal consistencies of α = .831 for ICL, α = .708 for ECL, and α = .876 for GCL. In line with Conway et al. (2005), who reported a clear advantage of partial credit scoring procedures over all-or-nothing scoring procedures, the partial load score for the OSPAN was computed by awarding one point for each correctly recalled letter. Across the three test blocks, the task achieved an appropriate internal consistency of Cronbach’s α = .805.
Results
Cognitive load progression
Some datasets had to be excluded from data analysis due to missing values or the failure to meet the 85% accuracy criterion in the OSPANFootnote 1 task, a lack in language proficiency, or an observable violation of the instruction. Conditional growth curve models were computed to inspect progressions in primary and secondary task efficiency from a temporal perspective. Values for all relevant variables were z-standardized to obtain standardized β coefficients. Models were fit with restricted maximum-likelihood estimation and included time, condition, the OSPAN score, and the interaction between time and condition predictors as fixed effects aligned to the experimental task design. To take into account individual differences between participants in reaction to experimental variations, a time slope as well as subject-specific intercepts were considered as random effects and assumed to be correlated. In addition, time was computed as a logarithmicFootnote 2 variable and included as a fixed effect. For evaluating model fit, the root mean squared error (RMSE) was obtained from a leave-one-out-cross-validation approach, and the conditional pseudo R2 for generalized linear mixed models was calculated.
Primary task efficiency
After exclusions, the analysis of primary task efficiency operated on n = 103 datasets. As indicated by Fig. 4, significant contributions resulted for the linear time predictor, β = .166, standard error (SE) = 0.030, t(683) = 5.609, p < .001, the logarithmic time predictor, β = 0.118, SE = 0.026, t(6385) = 4.573, p < .001, and condition, β = −.070, SE = 0.031, t(100) = − 2.220, p = .029. No significant interaction between time and condition could be observed, β = −.031, SE = 0.018, t(101) = − 1.726, p = .087. The model achieved an acceptable fit with RMSE = 0.936 and R2 = .197 and supports hypothesis 1a.
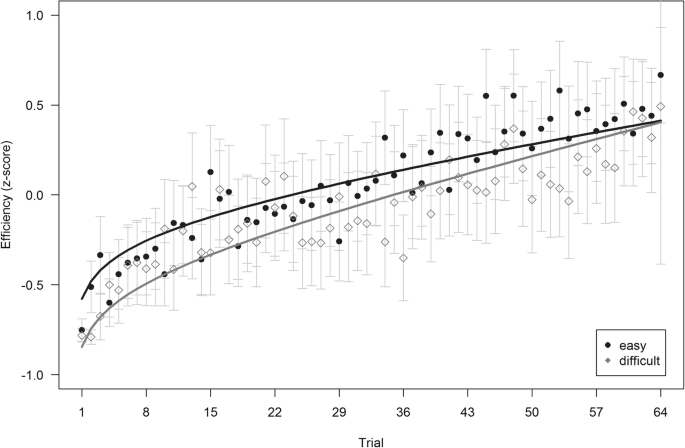
Changes in performance in primary task efficiency over the task. Filled dots and empty rhombi show empirical mean values per trial, lines indicate predicted mean values. Error bars indicate 95% confidence intervals from empirical observations
Secondary task efficiency
When analyzing secondary task efficiency, one additional dataset had to be excluded from the sample due to high noise in the recorded speech signal, resulting in a subsample of n = 102 participants. Corresponding to the prevention of distraction effects on the primary task from an overly complex secondary task, participants achieved a predominantly high word accuracy (M = 0.95, SD = 0.15). As visually supported by Fig. 5, the results revealed an increasing secondary task performance efficiency over time as well. In more detail, standardized coefficients showed a significant logarithmic time predictor, β = .160, SE = 0.022, t(6323) = 7.392, p < .001, whereas no significance could be obtained for the linear time predictor, β = .029, SE = 0.028, t(361) = 1.022, p = .307, the effect of condition, β = −.044, SE = 0.062, t(99) = − 0.711, p = .479, and the interaction between time and condition, β = −.006, SE = 0.021, t(100) = − 0.271, p = .787. The overall model achieved a considerable fit with RMSE = 0.912 and R2 = .445 and supports hypothesis 1a.
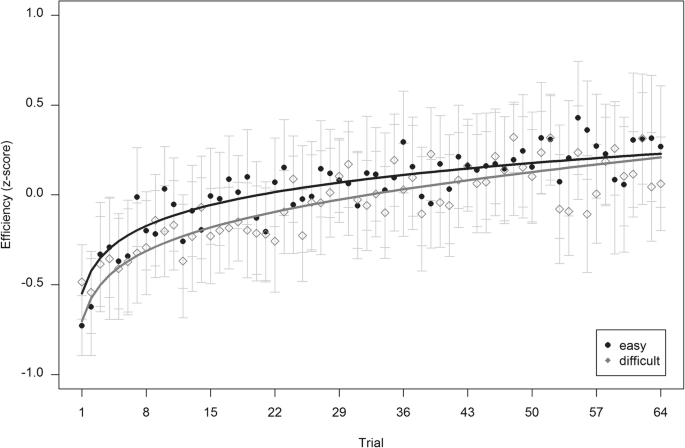
Changes in performance in secondary task efficiency over the task. Filled dots and empty rhombi show empirical mean values per trial, lines indicate predicted mean values. Error bars indicate 95% confidence intervals from empirical observations
Speech-related parameters
Corresponding to secondary task performance, results are based on n = 102 participants. Time series regressions with linear and logarithmic trend predictors, separated by conditions as depicted in Fig. 6, support decreases in cognitive load over time in terms of mean pause duration, R2easy = .063 and R2difficult = .216. In terms of number of pauses and articulation rate, the models achieved R2easy = .131 and R2difficult = .311 for number of pauses and R2easy = .165 and R2difficult = .268 for articulation rate. Although amounts of explained variance differ between measures and conditions, the overall trend supports hypothesis 1a.
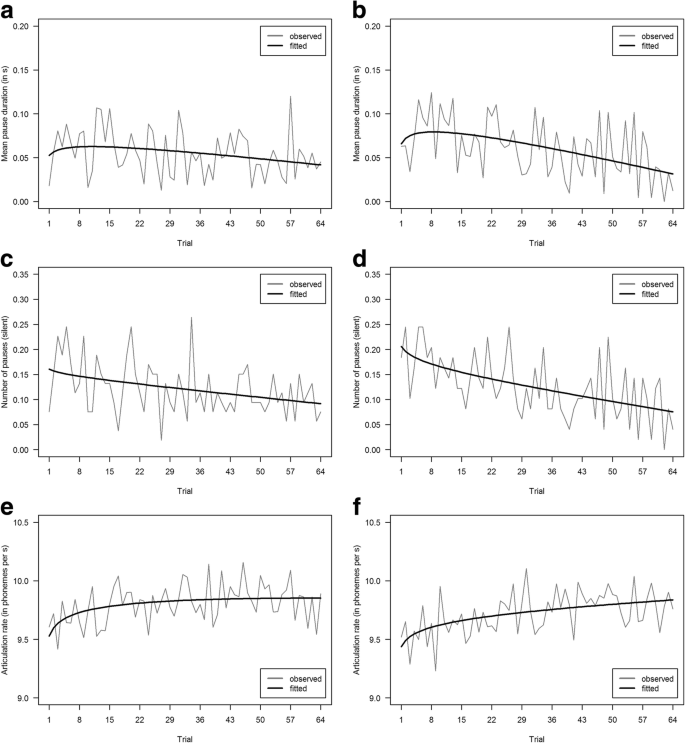
Observed and fitted logarithmic progressions of speech-related parameters computed per trial in easy (a, c, e) and difficult (b, d, f) conditions. Graphs in the first row refer to mean pause duration (total duration of silent pauses in seconds divided by the number of silent pauses). Graphs in the second row refer to the number of pauses (only silent pauses). Graphs in the third row refer to articulation rate (number of phonemes per second excluding pauses)
Physiological parameters
Due to technical errors in the recorded data, two additional datasets had to be excluded from the analysis, resulting in a subsample of n = 101 participants. Assuming additive time series with trend and seasonal components, analyses indicate a decreasing trend of HR and SCR over the task and show a repetitive seasonal pattern across “subtasks” within each trial. Logarithmic time series regression models, including linear and nonlinear trend predictors as well as seasonal predictors, achieved R2easy = .847 and R2difficult = .672 for SCR, whereas for HR an R2easy = .590 and R2difficult = .643 could be obtained. Inspecting the seasonal component in more detail, following an initial increase while the sequence of numbers was presented auditorily, a decreasing progression over the symbol presentation, symbol response, and symbol feedback could be observed. However, in the final step of verbally recalling the memorized numbers, physiological response parameters increased again. Fig. 7 displays the respective observed and fitted logarithmic progression curves, which strongly support hypothesis 1a.
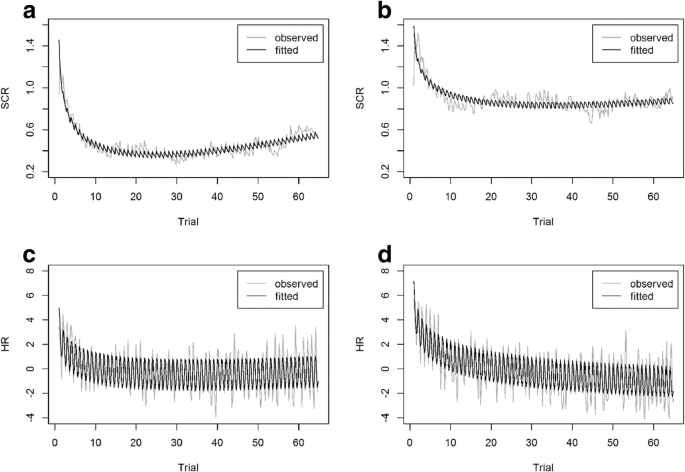
Observed and fitted logarithmic progressions of SCR and HR over time in easy (a, c) and difficult (b, d) conditions including both seasonal and trend components
Retention and transfer performance
Retention performance
Results for both retention and transfer performance are based on n = 103 participants. In terms of retention performance, in line with hypothesis 2a, significantly fewer correctly recalled symbol combinations could be observed in the difficult conditions, t(96.53) = 4.72, p < .001, d = − 0.92. No significant differences between conditions regarding the amount of totally recalled symbol combinations resulted, t(100.99) = − 0.08, p = .937, d = 0.02. A powerFootnote 3 level of 1 – β = .71 was achieved for α = .05 and d = 0.5.
Transfer performance
As already indicated from the descriptive values in Table 2, results revealed significantly faster responses in the difficult condition, F(1, 101) = 5.59, p = .020, ηp2 = .05, reversing the pattern postulated in hypothesis 2b. The significant increase in reaction time with increasing distortion, F(3, 303) = 15.13, p < .001, ηp2 = .13, partially supports hypothesis 2c. A significant interaction between both factors did not result, F(3, 303) = 0.60, p = .614, ηp2 = .01, 1 – β = 1.0 for α = .05 and f = .25. Post hoc pairwise comparisons using Tukey’s honest significant difference (HSD; Maxwell, 1980) indicate significant differences in reaction time between the prototypical level and all levels of distortion (all p’s < .05) as well as the distortion levels 30 and 90 (p < .001). After correction for inherited errors, no significant differences result in correct responses between conditions, F(1, 101) = 0.99, p = .323, ηp2 = .01, 1 – β = .941, and levels of distortion, F(3, 303) = 1.42, p = .237, ηp2 = .01, 1 – β = 1.0. Likewise, no significant interaction between both factors could be detected, F(3, 303) = 0.91, p = .436, ηp2 = .01, 1 – β = 1.0. All reported power levels relate to α = .05 and f = .25. In general, with around 70% in each level of distortion, a high frequency of correct responses was observable (see Table 2), hinting at a rather stable and robust application of previously acquired schemata.
Subjective cognitive load ratings
Contrary to hypothesis 1b, no significant differences between easy and difficult conditions appeared for ICL, t(90.76) = − 1.13, p = .225, d = 0.306, and ECL, t(97.57) = − 1.22, p = .226, d = 0.242, although descriptive values pointed towards lower scores for the easy condition. By contrast, significantly higher ratings in the easy condition resulted for GCL, t(98.77) = 2.87, p = .005, d = − 0.568, which directly reverses the pattern postulated in hypothesis 1b. According to Cohen (1988), the effect amounts to a medium size. Analyses achieved a power of 1 – β = .709 for α = .05 and d = 0.5.
Discussion
This study provided insight into the progression and interaction of the outlined facets of cognitive load by applying a multi-method approach to cognitive load assessment. In line with the postulated hypothesis, performance, speech, and physiological parameters indicated a logarithmically decreasing level of cognitive load over the task, hinting at increasing progress in schema acquisition. The subjective ratings did not support the initial assumptions, but support arises for the decrease in retention performance with higher levels of task complexity. For transfer performance, the stated hypothesis on increased transfer demands was partly confirmed in terms of reaction times, while evidence indicated a reversed pattern for task complexity in this case.
In addition, physiological measures revealed a repetitive seasonal pattern across the subtask routines for SCR and HR: during the presentation of the auditory stimulus at the outset of each trial, an increase was observable. It was followed by a decrease related to the visual presentation of the symbol combination, the motor response selection, and the visual feedback screen. As soon as the verbal response on the initially presented digit sequence was requested, increasing levels in both physiological measures again resulted. This evidence suggests higher levels of cognitive load imposed by the auditory-verbal compared to the visual-motor stimulus-response combination due to the observable initial and final increase in the emerging signal. Support for this assumption arises from Posner, Nissen, and Klein (1976), who state the dominance and increased familiarity of the visual modality compared to other modalities. Another potential clarification suggests increased perceptual load (Lavie, 2010) in the auditory-verbal secondary task, imposed by the additional visual stimulus from the speaker and speech bubble symbols shown on the screen.
Approaching the obtained pattern in the subjective cognitive load ratings, at least on a descriptive level participants reported lower ICL and ECL. On the one hand, these scores might have lacked statistical significance due to the reported insufficient power level of about 71%. On the other hand, as secondary task requirements did not differ between conditions, the absence of considerable differences in ECL is indeed plausible. Moreover, adding just one symbol to the combination might not have resulted in extensive increases in task complexity, potentially explaining the absence of significant differences in ICL. The reversed pattern for GCL could have originated in the particular formulation of the related questions, which emphasizes the subjective impression of understanding and knowledge acquisition. This might have been higher in the easy condition. The authors (Leppink et al., 2013) also discuss this issue in a more recent publication that applies this questionnaire (Leppink, Paas, Van Gog, Van der Vleuten, & Van Merriënboer, 2014). They attribute the lack of meaningful results for GCL to the substantial redundancy between GCL and ICL and take this as further evidence for the initially outlined re-reduction of the three-factor model. By contrast, a more recently developed cognitive load questionnaire by Klepsch, Schmitz, and Seufert (2017) addresses this issue by including the effort component more explicitly in the GCL facet and advocates the existing three-factor model from an assessment perspective. As the authors claim its applicability for a wider range of learning contexts and domains, using this questionnaire instead would be a valuable extension in future studies.
Regarding the schema application task, faster response times in the difficult condition compared to the easy condition hint at higher investments of mental resources with higher levels of task complexity. This explanation corresponds well with results on contextual interference (de Croock, Van Merriënboer, & Paas, 1998; Van Merriënboer et al., 2006) which report that learners can achieve a more robust and stable transfer performance under conditions that disable fast and easy skill acquisition. Additional support arises from evidence on desirable difficulties in learning situations (Bjork & Bjork, 2011). For instance, when learners must cope with interleaved tasks, they need to maintain sustained engagement of cognitive resources, which fosters performance. The observed increase in response times with increasing distortion may result due to the requirement of additional cognitive operations, as distorted symbols demand the identification of the underlying symbol category before the judgement.
Implications
The pattern of evidence supports a temporal extension of the CLT framework and reveals a logarithmically decreasing cognitive load progression with increasing schema acquisition. Moreover, results indicate the benefit of an automatic detection of the current level of cognitive load in speech parameters. This could be of value for realizing adaptive user interfaces in digital learning contexts that bear the ability to adjust task complexity and instructional guidance to learners’ needs and preferences. A particularly promising field of application comprises foreign language learning, where spoken interaction during the learning process constitutes an essential pre-requisite to shape language skills. User-aligned instructional aids within a considered language training program might then entail additional explanations or calming feedback if states of high load are detected by extended pausing or low articulation frequencies.
Limitations
A potential limitation arises from the differing symbol complexity, since a visually dominating appearance like a star, with salient edges and corners, could foster and speed up schema acquisition and thus benefit symbol recall. More detailed analyses of times spent on drawing different symbols in the retention questionnaire by mouse tracking or gaze pattern analyses might enlighten this issue in future research. With reference to the non-prototypical symbols used for the schema application task, although there was a high level of consensus in the pre-study regarding the correct match to the underlying prototype, subtle differences still could have persisted and influenced the findings in the main task.
The lack of significant differences between conditions in secondary task efficiency could have resulted from task order ambiguities. Although participants were instructed to give equal weight to both tasks, the secondary task occurred first in order and could have been regarded as more easy and familiar. For this reason, participants might have been motivated to prioritize this task instead of the primary task and assign only free resources to the primary task. In consequence, the easy task condition would achieve better results in primary task efficiency, whereas secondary task performance would stay unaffected by task complexity. The choice of keeping this fixed presentation order across all trials and participants is aligned to the original task procedure reported for automated complex span tasks (Redick et al., 2012; Unsworth et al., 2005). Using a counterbalanced presentation order instead could result in more balanced weighting of the priority of both tasks in future studies. A further valuable extension could address the relationship between both tasks more explicitly to obtain insights into participants’ strategies of cognitive resource distribution. The additional use of cognitive models (Anderson, 1983) that compare both task order strategies could support the clarification of distinct effects of task order prioritization.
Future research
Prospective research should monitor learners’ focus on presented symbols or alternative learning material by inspecting gaze behavior in combination with pupil dilation, as suggested by Foroughi, Sibley, and Coyne (2017) and Mitra, McNeal, and Bondell (2017). Another promising extension incorporates the transfer of the obtained patterns and mechanisms to more applied task settings in a different task domain like motor learning. In this domain, an additional step could involve the inclusion of a spatial dimension or the use of animated stimuli or motor sequences, and distinct audio-verbal secondary tasks with a different task order are suitable as well. A further interesting extension takes evidence on modality compatibility in dual-task settings (Hazeltine et al., 2006) into account and inspects the use of incompatible content-modality matchings.
Conclusion
The study applied a multi-measure framework of cognitive load assessment to gain further insights into the temporal progression of cognitive load during schema acquisition. Results replicate the logarithmic pattern of change over the task observed in prior research and reveal influences of task complexity and situational constraints. In summary, the promising approach holds value to address existing research gaps in cognitive load research and gain better insights into changing demands from schema acquisition in learning settings.
Notes
This exclusion involved seven participants, which corresponds to about 6% of the sample. For comparison, Unsworth et al. (2005) report exclusion rates of 15%.
In line with Wirzberger et al. (2017), alternative linear and quadratic progression models were tested as well, but not reported due to the confirmed advantage of the logarithmic model and the lack of benefit for the focus of this study.
Power analyses refer to theoretically assumed population effect sizes to provide a broader informative value for the reasoning about non-significant results (O'Keefe, 2007).
Abbreviations
- ANOVA:
-
Analysis of variance
- CLT:
-
Cognitive load theory
- ECL:
-
Extraneous cognitive load
- GCL:
-
Germane cognitive load
- HR:
-
Heart rate
- HSD:
-
Honest significant difference
- ICL:
-
Intrinsic cognitive load
- OSPAN:
-
Operation span task
- RMSE:
-
Root mean squared error
- SCR:
-
Skin conductance response
- SE:
-
Standard error
- STEM:
-
Science, Technology, Engineering, and Mathematics
References
Anderson, J. R. (1983). The architecture of cognition. Cambridge: Harvard University Press.
Atkinson, C., & Shiffrin, R. M. (1971). The control of short-term memory. Scientific American, 225, 82–90 Stable URL: http://www.jstor.org/stable/24922803.
Baddeley, A. D. (1992). Working memory. Science, 255, 556–559. https://doi.org/10.1126/science.1736359.
Bartlett, F. C. (1932). Remembering: An experimental and social study. Cambridge: Cambridge University Press.
Beckmann, J. F. (2010). Taming a beast of burden – On some issues with the conceptualisation and operationalisation of cognitive load. Learning and Instruction, 20, 250–264. https://doi.org/10.1016/j.learninstruc.2009.02.024.
Berthold, A., & Jameson, A. (1999). Interpreting symptoms of cognitive load in speech input. In UM99 user modeling, (pp. 235–244). New York: Springer Science + Business Media.
Bjork, E. L., & Bjork, R. A. (2011). Making things hard on yourself, but in a good way: Creating desirable difficulties to enhance learning. In M. A. Gernsbacher, R. W. Pew, L. M. Hough, & J. R. Pomerantz (Eds.), Psychology and the real world: Essays illustrating fundamental contributions to society, (pp. 56–64). New York: Worth Publishers.
Brünken, R., Plass, J. L., & Leutner, D. (2004). Assessment of cognitive load in multimedia learning with dual-task methodology: Auditory load and modality effects. Instructional Science, 32, 115–132. https://doi.org/10.1023/B:TRUC.0000021812.96911.c5.
Brünken, R., Steinbacher, S., Plass, J. L., & Leutner, D. (2002). Assessment of cognitive load in multimedia learning using dual-task methodology. Experimental Psychology, 49, 109–119. https://doi.org/10.1027//1618-3169.49.2.109.
Chen, F., Zhou, J., & Yu, K. (2018). Multimodal and data-driven cognitive load measurement. In R. Zheng (Ed.), Cognitive load measurement and application: A theoretical framework for meaningful research and practice, (pp. 3643–4043). New York: Routledge.
Cohen, J. (1988). Statistical power analysis for the behavioral sciences (2 ed.). Hillsdale, NJ: Erlbaum.
Conway, A. R. A., Kane, M. J., Bunting, M. F., Hambrick, D. Z., Wilhelm, O., & Engle, R. W. (2005). Working memory span tasks: A methodological review and user’s guide. Psychonomic Bulletin & Review, 12, 769–786. https://doi.org/10.3758/BF03196772.
De Croock, M. B., Van Merriënboer, J. J., & Paas, F. G. (1998). High versus low contextual interference in simulation-based training of troubleshooting skills: Effects on transfer performance and invested mental effort. Computers in Human Behavior, 14, 249–267. https://doi.org/10.1016/S0747-5632(98)00005-3.
De Jong, T. (2010). Cognitive load theory, educational research and instructional design: Some food for thought. Instructional Science, 38, 105–134. https://doi.org/10.1007/s11251-009-9110-0.
Ebbinghaus, H. (1964). Memory: A contribution to experimental psychology. Mineola: Dover Publications.
Esposito, A., Stejskal, V., Smékal, Z., & Bourbakis, N. (2007). The significance of empty speech pauses: Cognitive and algorithmic issues. In International Symposium on Brain, Vision, and Artificial Intelligence, (pp. 542–554). New York: Springer.
Foroughi, C. K., Sibley, C., & Coyne, J. T. (2017). Pupil size as a measure of within-task learning. Psychophysiology, 54, 1–8. https://doi.org/10.1111/psyp12896.
Ghosh, V. E., & Gilboa, A. (2014). What is a memory schema? A historical perspective on current neuroscience literature. Neuropsychologia, 53, 104–114. https://doi.org/10.1016/j.neuropsychologia.2013.11.010.
Hazeltine, E., Ruthruff, E., & Remington, R. W. (2006). The role of input and output modality pairings in dual-task performance: Evidence for content-dependent central interference. Cognitive Psychology, 52, 291–345. https://doi.org/10.1016/j.cogpsych.205.11.001.
Herms, R. (2016). Prediction of deception and sincerity from speech using automatic phone recognition-based features. In N. Morgan (Ed.), Interspeech 2016, 17th Annual Conference of the International Speech Communication Association, (pp. 2036–2040). San Francisco: ISCA.
Hoffman, B., & Schraw, G. (2010). Conceptions of efficiency: Applications in learning and problem solving. Educational Psychologist, 45, 1–14. https://doi.org/10.1080/00461520903213618.
Kalyuga, S. (2010). Schema acquisition and sources of cognitive load. In J. L. Plass, R. Moreno, & R. Brünken (Eds.), Cognitive load theory, (pp. 48–64). New York: Cambridge University Press.
Kalyuga, S. (2011). Cognitive load theory: How many types of load does it really need? Educational Psychology Review, 23, 1–19. https://doi.org/10.1007/s10648-010-9150-7.
Kalyuga, S., & Singh, A. M. (2016). Rethinking the boundaries of cognitive load theory in complex learning. Educational Psychology Review, 28, 831–852.
Khawaja, M. A., Ruiz, N., & Chen, F. (2007). Potential speech features for cognitive load measurement. In Proceedings of the 19th Australasian conference on Computer-Human Interaction: Entertaining User Interfaces, (pp. 57–60). Chicago: ACM.
Khawaja, M. A., Ruiz, N., & Chen, F. (2008). Think before you talk: An empirical study of relationship between speech pauses and cognitive load. In Proceedings of the 20th Australasian Conference on Computer-Human Interaction: Designing for Habitus and Habitat, (pp. 335–338). Chicago: ACM.
Klepsch, M., Schmitz, F., & Seufert, T. (2017). Development and validation of two instruments measuring intrinsic, extraneous, and germane cognitive load. Frontiers in Psychology, 8, 1997. https://doi.org/10.3389/fpsyg.2017.01997.
Korbach, A., Brünken, R., & Park, B. (2018). Differentiating different types of cognitive load: A comparison of different measures. Educational Psychology Review, 30, 503–529. https://doi.org/10.1007/s10648-017-9404-8.
Kraiger, K., Ford, J. K., & Salas, E. (1993). Application of cognitive, skill-based, and affective theories of learning outcomes to new methods of training evaluation. Journal of Applied Psychology, 78, 311–328. https://doi.org/10.1037//0021-9010.78.2.311.
Lavie, N. (2010). Attention, distraction, and cognitive control under load. Current Directions in Psychological Science, 19, 143–148. https://doi.org/10.1177/0963721410370295.
Lee, K.-F. (1988). Automatic speech recognition: The development of the SPHINX system, (vol. 62). New York: Springer Science + Business Media.
Leppink, J., Paas, F., Van der Vleuten, C. P., Van Gog, T., & Van Merriënboer, J. J. (2013). Development of an instrument for measuring different types of cognitive load. Behavior Research Methods, 45, 1058–1072. https://doi.org/10.3758/s13428-013-0334-1.
Leppink, J., Paas, F., Van Gog, T., Van der Vleuten, C. P. M., & Van Merriënboer, J. J. G. (2014). Effects of pairs of problems and examples on task performance and different types of cognitive load. Learning and Instruction, 30, 32–42. https://doi.org/10.1016/j.learninstruc.2013.12.001.
Lozano, L. M., García-Cueto, E., & Muñiz, J. (2008). Effect of the number of response categories on the reliability and validity of rating scales. Methodology, 4, 73–79. https://doi.org/10.1027/1614-2241.4.2.73.
Martin, S. (2018). A critical analysis of the theoretical construction and empirical measurement of cognitive load. In R. Zheng (Ed.), Cognitive load measurement and application: A theoretical framework for meaningful research and practice, (pp. 778–1155). New York: Routledge.
Mathôt, S., Schreij, D., & Theeuwes, J. (2012). OpenSesame: An open-source, graphical experiment builder for the social sciences. Behavior Research Methods, 44, 314–324. https://doi.org/10.3758/s13428-011-0168-7.
Maxwell, S. E. (1980). Pairwise multiple comparisons in repeated measures designs. Journal of Educational Statistics, 5, 269–287. https://doi.org/10.3102/10769986005003269.
Mehler, B., Reimer, B., & Coughlin, J. F. (2012). Sensitivity of physiological measures for detecting systematic variations in cognitive demands from a working memory task: An on-road study across three age groups. Human Factors, 54, 396–412. https://doi.org/10.1177/0018720812442086.
Mitra, R., McNeal, K. S., & Bondell, H. D. (2017). Pupillary response to complex interdependent tasks: A cognitive-load theory perspective. Behavior Research Methods, 49, 1905–1919. https://doi.org/10.3758/s13428-016-0833-y.
Müller, C., Großmann-Hutter, B., Jameson, A., Rummer, R., & Wittig, F. (2001). Recognizing time pressure and cognitive load on the basis of speech: An experimental study. In International Conference on User Modeling, (pp. 24–33). New York: Springer Science + Business Media.
O’Donnell, R. D., & Eggemeier, F. T. (1986). Workload assessment methodology. In K. R. Boff, L. Kaufmann, & J. P. Thomas (Eds.), Handbook of perception and performance. Vol. II. Cognitive processes and performance, (pp. 42/1–42/49). New York: Wiley.
O'Keefe, D. J. (2007). Brief report: Post hoc power, observed power, a priori power, retrospective power, prospective power, achieved power: Sorting out appropriate uses of statistical power analyses. Communication Methods and Measures, 1, 291–299. https://doi.org/10.1080/19312450701641375.
Paas, F., & Van Gog, T. (2006). Optimising worked example instruction: Different ways to increase germane cognitive load. Learning and Instruction, 16, 87–91. https://doi.org/10.1016/j.learninstruc.2006.02.004.
Park, B. (2010). Testing the additivity hypothesis of cognitive load theory (Doctoral dissertation, Saarland University, Saarbruecken, Germany). Retrieved from https://publikationen.sulb.uni-saarland.de/bitstream/20.500.11880/23365/1/Dissertation_BP_2010.pdf
Park, B., & Brünken, R. (2018). Secondary task as a measure of cognitive load. In R. Zheng, (Ed.). Cognitive load measurement and application: A theoretical framework for meaningful research and practice (pp. 1901-2317). New York, NY, USA: Routledge.
Piaget, J. (1952). The origins of intelligence in children. New York: International Universities Press.
Posner, M. I., Nissen, M. J., & Klein, R. M. (1976). Visual dominance: An information-processing account of its origins and significance. Psychological Review, 83, 157. https://doi.org/10.1037/0033-295X.83.2.157.
Redick, T. S., Broadway, J. M., Meier, M. E., Kuriakose, P. S., Unsworth, N., Kane, M. J., & Engle, R. W. (2012). Measuring working memory capacity with automated complex span tasks. European Journal of Psychological Assessment, 28, 164–171. https://doi.org/10.1027/1015-5759/a000123.
Rumelhart, D. E. (1980). Schemata: The building blocks of cognition. In R. J. Spiro, B. C. Bruce, & W. F. Brewer (Eds.), Theoretical issues in reading comprehension. Perspectives from cognitive psychology, linguistics, artificial intelligence, and education, (pp. 33–58). Hillsdale: Lawrence Erlbaum Associates, Inc.
Shiffrin, R. M., & Schneider, W. (1977). Controlled and automatic human information processing: II. Perceptual learning, automatic attending and a general theory. Psychological Review, 84, 127–190. https://doi.org/10.1037/0033-295X.84.2.127.
Sonnenfeld, N. A., & Keebler, J. R. (2016). A quantitative model for unifying human factors with cognitive load theory. In Proceedings of the Human Factors and Ergonomics Society Annual Meeting, (pp. 403–407). Los Angeles: SAGE Publications.
Sweller, J. (2010). Element interactivity and intrinsic, extraneous, and germane cognitive load. Educational Psychology Review, 22, 123–138. https://doi.org/10.1007/s10648-010-9128-5.
Sweller, J., Ayres, P., & Kalyuga, S. (2011). Cognitive load theory. New York: Springer Science + Business Media.
Sweller, J., Van Merriënboer, J. J., & Paas, F. G. (1998). Cognitive architecture and instructional design. Educational Psychology Review, 10, 251–296. https://doi.org/10.1023/A:1022193728205.
Unsworth, N., Heitz, R. P., Schrock, J. C., & Engle, R. W. (2005). An automated version of the operation span task. Behavior Research Methods, 37, 498–505. https://doi.org/10.3758/BF03192720.
Van Merriënboer, J. J., Kester, L., & Paas, F. (2006). Teaching complex rather than simple tasks: Balancing intrinsic and germane load to enhance transfer of learning. Applied Cognitive Psychology, 20, 343–352. https://doi.org/10.1002/acp.1250.
Wickens, C. D., Hollands, J. G., Banbury, S., & Parasuraman, R. (2013). Engineering psychology and human performance, (4th ed., ). Upper Saddle River: Pearson Education.
Wirzberger, M., Beege, M., Schneider, S., Nebel, S., & Rey, G. D. (2016). One for all?! Simultaneous examination of load-inducing factors for advancing media-related instructional research. Computers & Education, 100, 18–31. https://doi.org/10.1016/j.compedu.2016.04.010.
Wirzberger, M., Esmaeili Bijarsari, S., & Rey, G. D. (2017). Embedded interruptions and task complexity influence schema-related cognitive load progression in an abstract learning task. Acta Psychologica, 179, 30–41. https://doi.org/10.1016/j.actpsy.2017.07.001.
Yap, T. F. (2012). Speech production under cognitive load: effects and classification (Doctoral dissertation, University of New South Wales, Sydney, Australia). Retrieved from http://unsworks.unsw.edu.au/fapi/datastream/unsworks:10507/SOURCE02?view=true
Zheng, R. (2018). Cognitive load measurement and application: a theoretical framework for meaningful research and practice. New York: Routledge.
Acknowledgements
Thanks to Robert Alig and Laura Seelig for their help with data collection and preparation.
Funding
The reported research was conducted with funding from the German Research Foundation/DFG grant GRK 1780/1. The publication costs of this article were funded by the German Research Foundation/DFG and TU Chemnitz in the funding program Open Access Publishing.
Availability of data and materials
The materials and the datasets analyzed during the study are available on request.
Author information
Authors and Affiliations
Contributions
MW is the lead author of the manuscript and the responsible coordinator of the conducted study. MW and RH developed the underlying research design, collected, prepared, and analyzed the empirical data, and prepared the initial draft of the manuscript. SEB contributed to the research design, collected and prepared the empirical data, and supported data analysis and manuscript preparation. ME and GDR provided critical revisions on the research design and/or the manuscript. All authors read and approved the final manuscript.
Corresponding author
Ethics declarations
Ethics approval and consent to participate
Informed consent to participate in the study was obtained from each participant in line with the ethical guidelines of the German Society for Psychology (DGPs). The study was approved by the Managing Director of the Institute for Media Research, Faculty of Humanities, Technische Universität (TU) Chemnitz, as formal approval by an ethics committee is not mandatory for psychological research in Germany.
Consent for publication
Not applicable.
Competing interests
The authors declare that they have no competing interests.
Publisher’s Note
Springer Nature remains neutral with regard to jurisdictional claims in published maps and institutional affiliations.
Rights and permissions
Open Access This article is distributed under the terms of the Creative Commons Attribution 4.0 International License (http://creativecommons.org/licenses/by/4.0/), which permits unrestricted use, distribution, and reproduction in any medium, provided you give appropriate credit to the original author(s) and the source, provide a link to the Creative Commons license, and indicate if changes were made.
About this article

Cite this article
Wirzberger, M., Herms, R., Esmaeili Bijarsari, S. et al. Schema-related cognitive load influences performance, speech, and physiology in a dual-task setting: A continuous multi-measure approach. Cogn. Research 3, 46 (2018). https://doi.org/10.1186/s41235-018-0138-z
Received:
Accepted:
Published:
DOI: https://doi.org/10.1186/s41235-018-0138-z